netneurotools.plotting.plot_mod_heatmap
- netneurotools.plotting.plot_mod_heatmap(data, communities, *, inds=None, edgecolor='black', ax=None, figsize=(6.4, 4.8), xlabels=None, ylabels=None, xlabelrotation=90, ylabelrotation=0, cbar=True, square=True, xticklabels=None, yticklabels=None, mask_diagonal=True, **kwargs)[source]
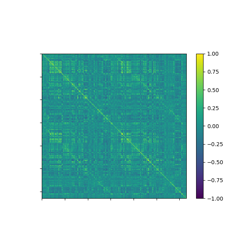
Plot data as heatmap with borders drawn around communities.
- Parameters:
data ((N, N) array_like) – Correlation matrix
communities ((N,) array_like) – Community assignments for data
inds ((N,) array_like, optional) – Index array for sorting data within communities. If None, these will be generated from data. Default: None
edgecolor (str, optional) – Color for lines demarcating community boundaries. Default: ‘black’
ax (matplotlib.axes.Axes, optional) – Axis on which to plot the heatmap. If none provided, a new figure and axis will be created. Default: None
figsize (tuple, optional) – Size of figure to create if ax is not provided. Default: (20, 20)
{x,y}labels (list, optional) – List of labels on {x,y}-axis for each community in communities. The number of labels should match the number of unique communities. Default: None
{x,y}labelrotation (float, optional) – Angle of the rotation of the labels. Available only if {x,y}labels provided. Default : xlabelrotation: 90, ylabelrotation: 0
square (bool, optional) – Setting the matrix with equal aspect. Default: True
{x,y}ticklabels (list, optional) – Incompatible with {x,y}labels. List of labels for each entry (not community) in data. Default: None
cbar (bool, optional) – Whether to plot colorbar. Default: True
mask_diagonal (bool, optional) – Whether to mask the diagonal in the plotted heatmap. Default: True
kwargs (key-value mapping) – Keyword arguments for plt.pcolormesh()
- Returns:
ax – Axis object containing plot
- Return type: